Amid the market uncertainty, Ethereum witnessed a notable 4.57% dip in just a single day, currently trading at $2.399K. This decline mirrors the overall bearish trend in the global crypto market, as many other cryptocurrencies have also experienced similar losses. For instance, Bitcoin plummeted over 4%, stabilizing around $56,566.
Following this negative sentiment, ETH’s intraday market cap declined to $288.78 billion, positioning it in the 2nd spot in crypto rankings. However, the cryptocurrency’s trading volume paints a contrasting image.


As observed on CoinMarketCap, it surged massively by 69.93% to the $16.22 billion threshold, indicating increased activity, which often proceeds significant price movements.
Ethereum Forms a Double-Bottom Pattern
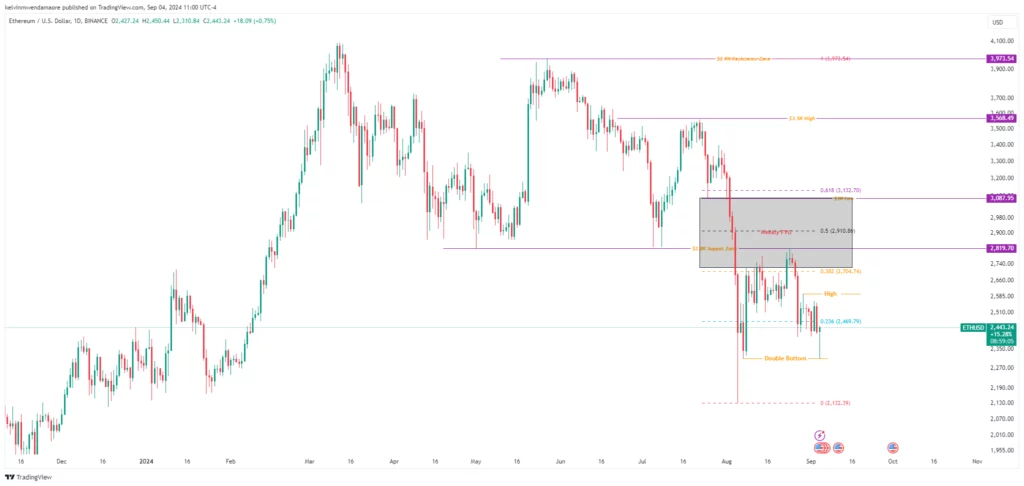
Data from the TradingView chart shows that the ETH token has exhibited a two-day streak of bearish sentiment, pushing it to the $2,310 support level, where it formed a double-bottom pattern. This pattern often signals a potential trend reversal from bearish to bullish.


Characterized by two distinct lows at approximately the same price level, this implies that the selling pressure might be exhausting, and buyers could soon take control. True to its nature, Ethereum bounced back upon hitting this level, stabilizing close to the $2,400 mark. This confirms that buyers are stepping in to defend the support level.
However, caution is advised, as on-chain data hints that bearish sentiment still controls Ethereum’s market. Data from CoinGlass reveals that the OI-weighted funding rate is trending in the red zone, reflecting a 0.0024% dip in the last 24 hours. This means that short position holders are willing to pay a discount to maintain their positions, indicating a lack of confidence in a bullish reversal.


Moreover, the asset’s open interest ebbed by 1.38% to $10.49 billion within the same period. Not to be outdone, the long/short indicator is presently trending below 1, suggesting that more short positions are open than long positions. This imbalance could lead to further downward pressure on Ethereum’s price in the near term.
Is Price Reversal Next?
Assuming the double bottom proves reliable and sets off a strong price recovery, market analysts believe ETH could rise to its immediate high at $2,592. A breach above this level could suggest a break of structure (BOS), pushing Ethereum toward retesting the $2.8K resistance, an area that previously proved to be robust support.
On the negative side, if the bearish pressure continues and the double bottom is broken, Ethereum’s price could fall to the next target at $2,132, last seen on August 5. A beach below this level could see the token hit lower lows not seen this year and linger around the $2K mark.
This scenario would reaffirm the bearish control over the market, possibly leading to further declines as traders might look to offload positions to avoid more profound losses.
Also Read: Ripple Price Surge 5% to $0.53; XRP Weekend Outlook Bullish?
Source: https://www.cryptonewsz.com/ethereum-price-dip-double-bottom-reversal-sign/