Amidst the broader market correction, the Bitcoin price falling under the $58,000 support level and the Ethereum price down under $2,500, the altcoin market is burning.
In the burning segment, the Meme Coins take a massive hit. The top Meme Coins crashed in double digits last week, with a 12.43% drop in the segment-leader Dogecoin trading under the $0.10 psychological mark.
Crossroads For Dogecoin At $0.094
In the last 24 hours, it has been down by 3.72% and is currently trading at $0.09534. The market cap is down under the $14 billion mark, and the overall segment is at $38.46 billion.
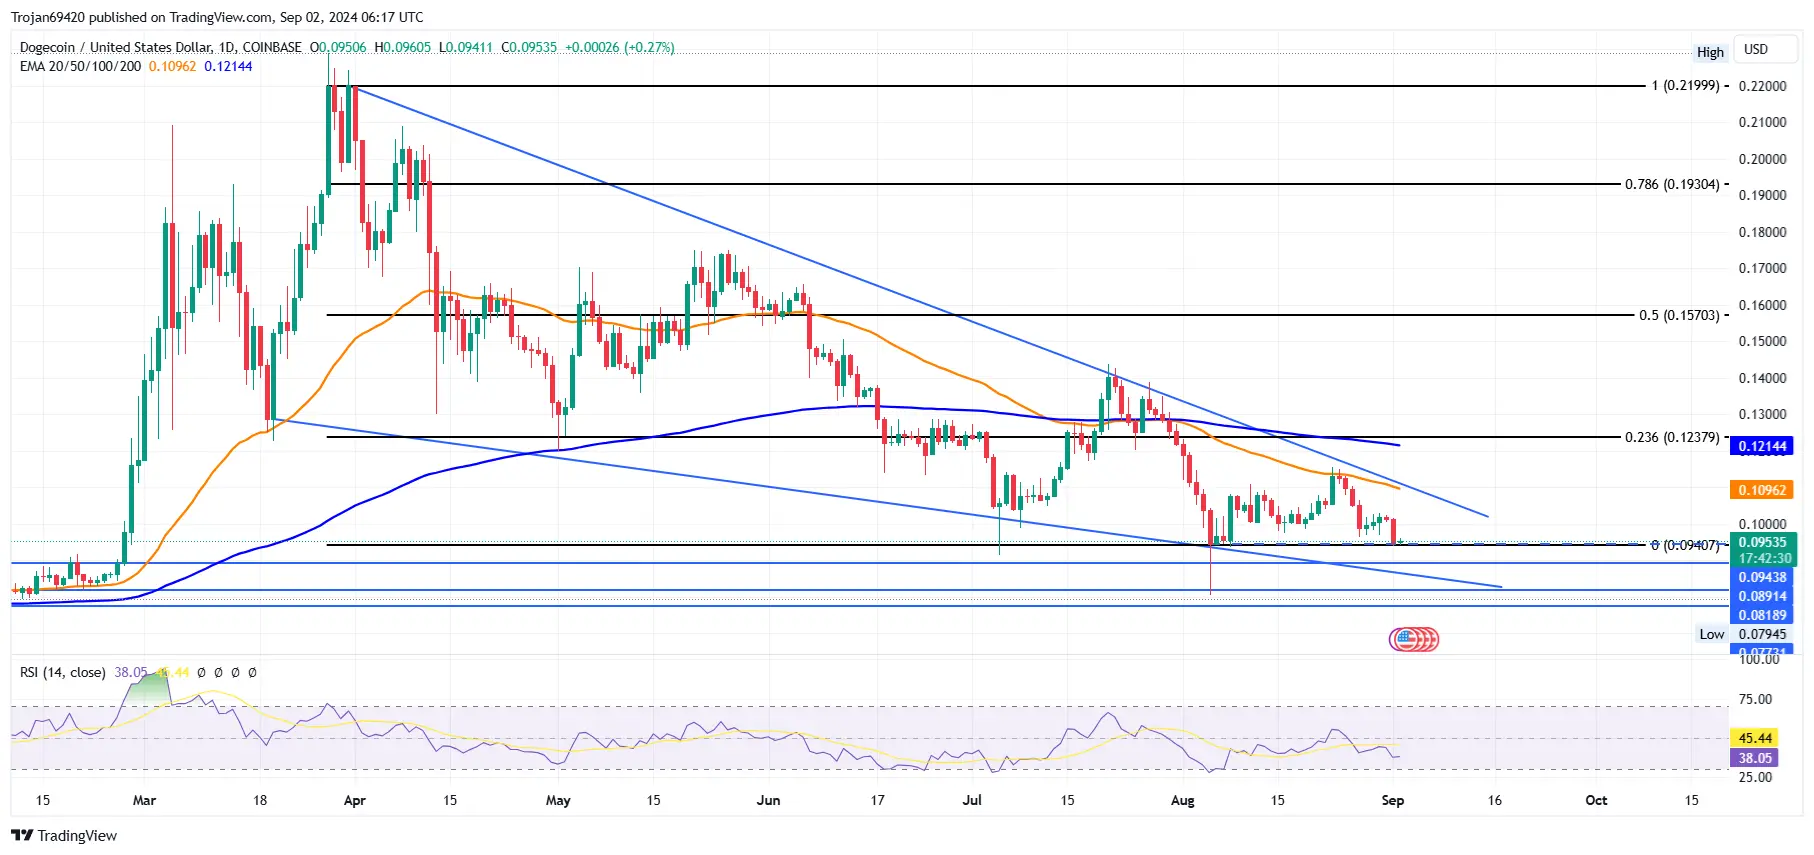
In the daily chart, the Dogecoin price action reveals a falling wedge pattern. A 58.49% drop from its 52-week high at $0.22899. The massive correction in the last five months has finally broken under the $0.10 psychological mark for the second time.
Source: Tradingview
Furthermore, the bearish influence results in a death cross between the 50-day and 200-day EMAs. However, the Meme Coin is finding support at an unexpected level of $0.094. Furthermore, the daily RSI line reveals a bullish divergence between the current drop and the past bottom formation at this level.
Hence, the underlying momentum projects a potential turnaround if the Meme Coin exceeds $0.094.
Despite a 3.04% Dip, Majority Still in the Money
Despite the recent correction, the on-chain technical figures from intotheblock show 68% of Dogecoin holders are making money at the current price. However, the 62% concentration by large holders likely puts the short-term and smallholders out of the “in the money” zone.
Further, the on-chain signals reveal a 1.88% surge in large transactions, and the bid-to-ask volume imbalance has increased by 0.34%, while the smart price has increased by 0.31%.
On the flip side, the 3.04% of in-the-money addresses have slipped below, with the net network growth declining by 0.09%. Nevertheless, the on-chain signals maintain a mostly bullish signal with a 3-to-2 ratio.
Read more: Dogecoin Price Prediction
Crucial Dogecoin Levels
Based on the Fibonacci level and the price action, the overhead resistances for Dogecoin are present at the 50-day EMA in confluence with the overhead resistance trendline, near $0.10962.
Beyond this, the secondary target is the 200-day EMA near the 23.60% level at $0.12379. On the downside, a breakdown under $0.094 can put additional pressure on the next support levels at $0.089, $0.081, and $0.07731.
Source: https://www.cryptonewsz.com/dogecoin-bullish-rsi-divergence-have-reversal/

