- More than $300M was liquidated from the crypto market, as prices retraced from the weekend rally.
- Bitcoin dropped from $62K to below $59K before making a slight recovery.
The cryptocurrency market bled today, with derivative traders taking a major blow. Per Coinglass, the futures market experienced $320 million in liquidations at the time of writing. Traders with long positions experienced the most losses with $285 million liquidated.
This comes amid a drastic price drop that saw the total crypto market cap tank by 6.7%. All the top 50 cryptos by market cap were also trading in the red.
Bitcoin [BTC)] dropped by 6% to hit a weekly low of around $58,000. It has recovered slightly to trade at $59,430 at the time of writing.
Ethereum [ETH] experienced a steeper decline of 7.8% to trade at $2,430 while Solana [SOL] dropped 6.8% to $148. XRP and Dogecoin [DOGE] also posted 3.7% and 6% dips, respectively.
What caused the liquidations?
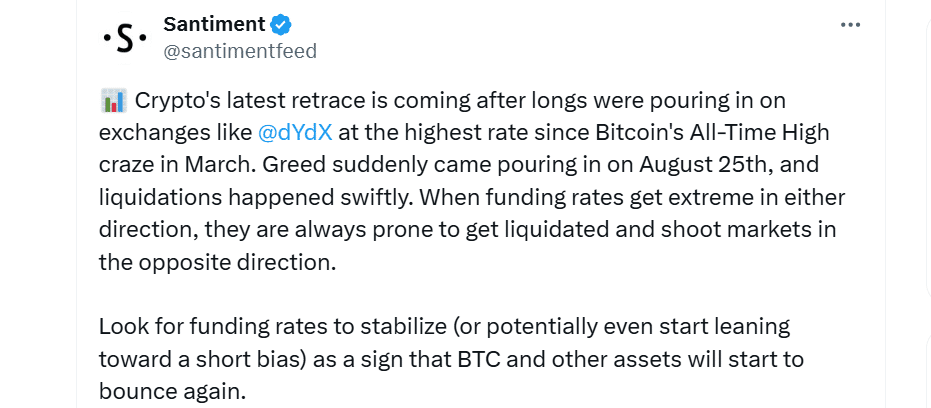
On-chain analytics platform Santiment attributed the liquidations to market greed after longs increased their positions following the 25th August rebound. This stirred a massive spike in funding rates, which were bound to get liquidated.


Source: X
Macro factors could also be behind the volatility. Nvidia is about to release what has been popularly called “the most important tech earnings.” Per CNBC, Nvidia’s results will “set the tone” for markets before the release of other key economic data next month.
Nvidia earnings typically stir market volatility. If the chip-making company beats expectations in its Q2 earnings, it could boost a rally across the crypto market. However, if the company falls short, it could cause further declines.
Will BTC price rebound?
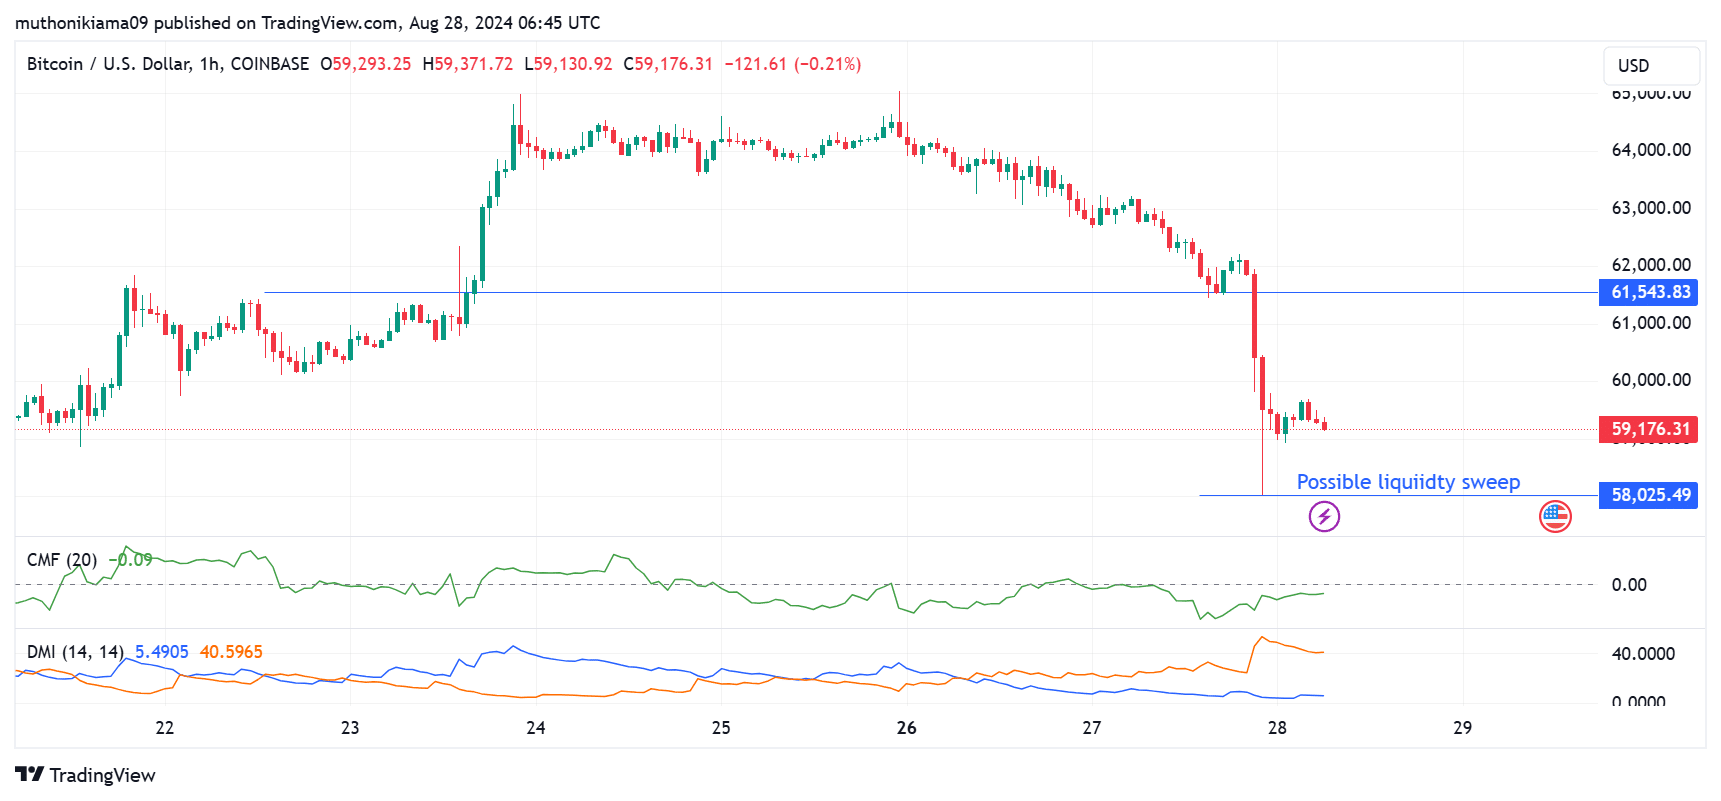
Bitcoin price failed to hold a support level above $61,500, causing a steep decline in price. Since 23rd August, BTC has been trading above this level, and maintaining the support supported the uptrend.
The Chaikin Money Flow was negative at press time, suggesting selling pressure. The CMF showed that buying pressure started weakening after the weekend rally. Therefore, there have not been enough buyers to drive the price action.


Source: Tradingview
The bearish thesis is further confirmed by the Directional Movement Indicators (DMI). The positive DI is far below the negative DI, which shows that the bearish trend is stronger than the bullish trend.
Traders should also watch out for a possible liquidity sweep at the $58K level.
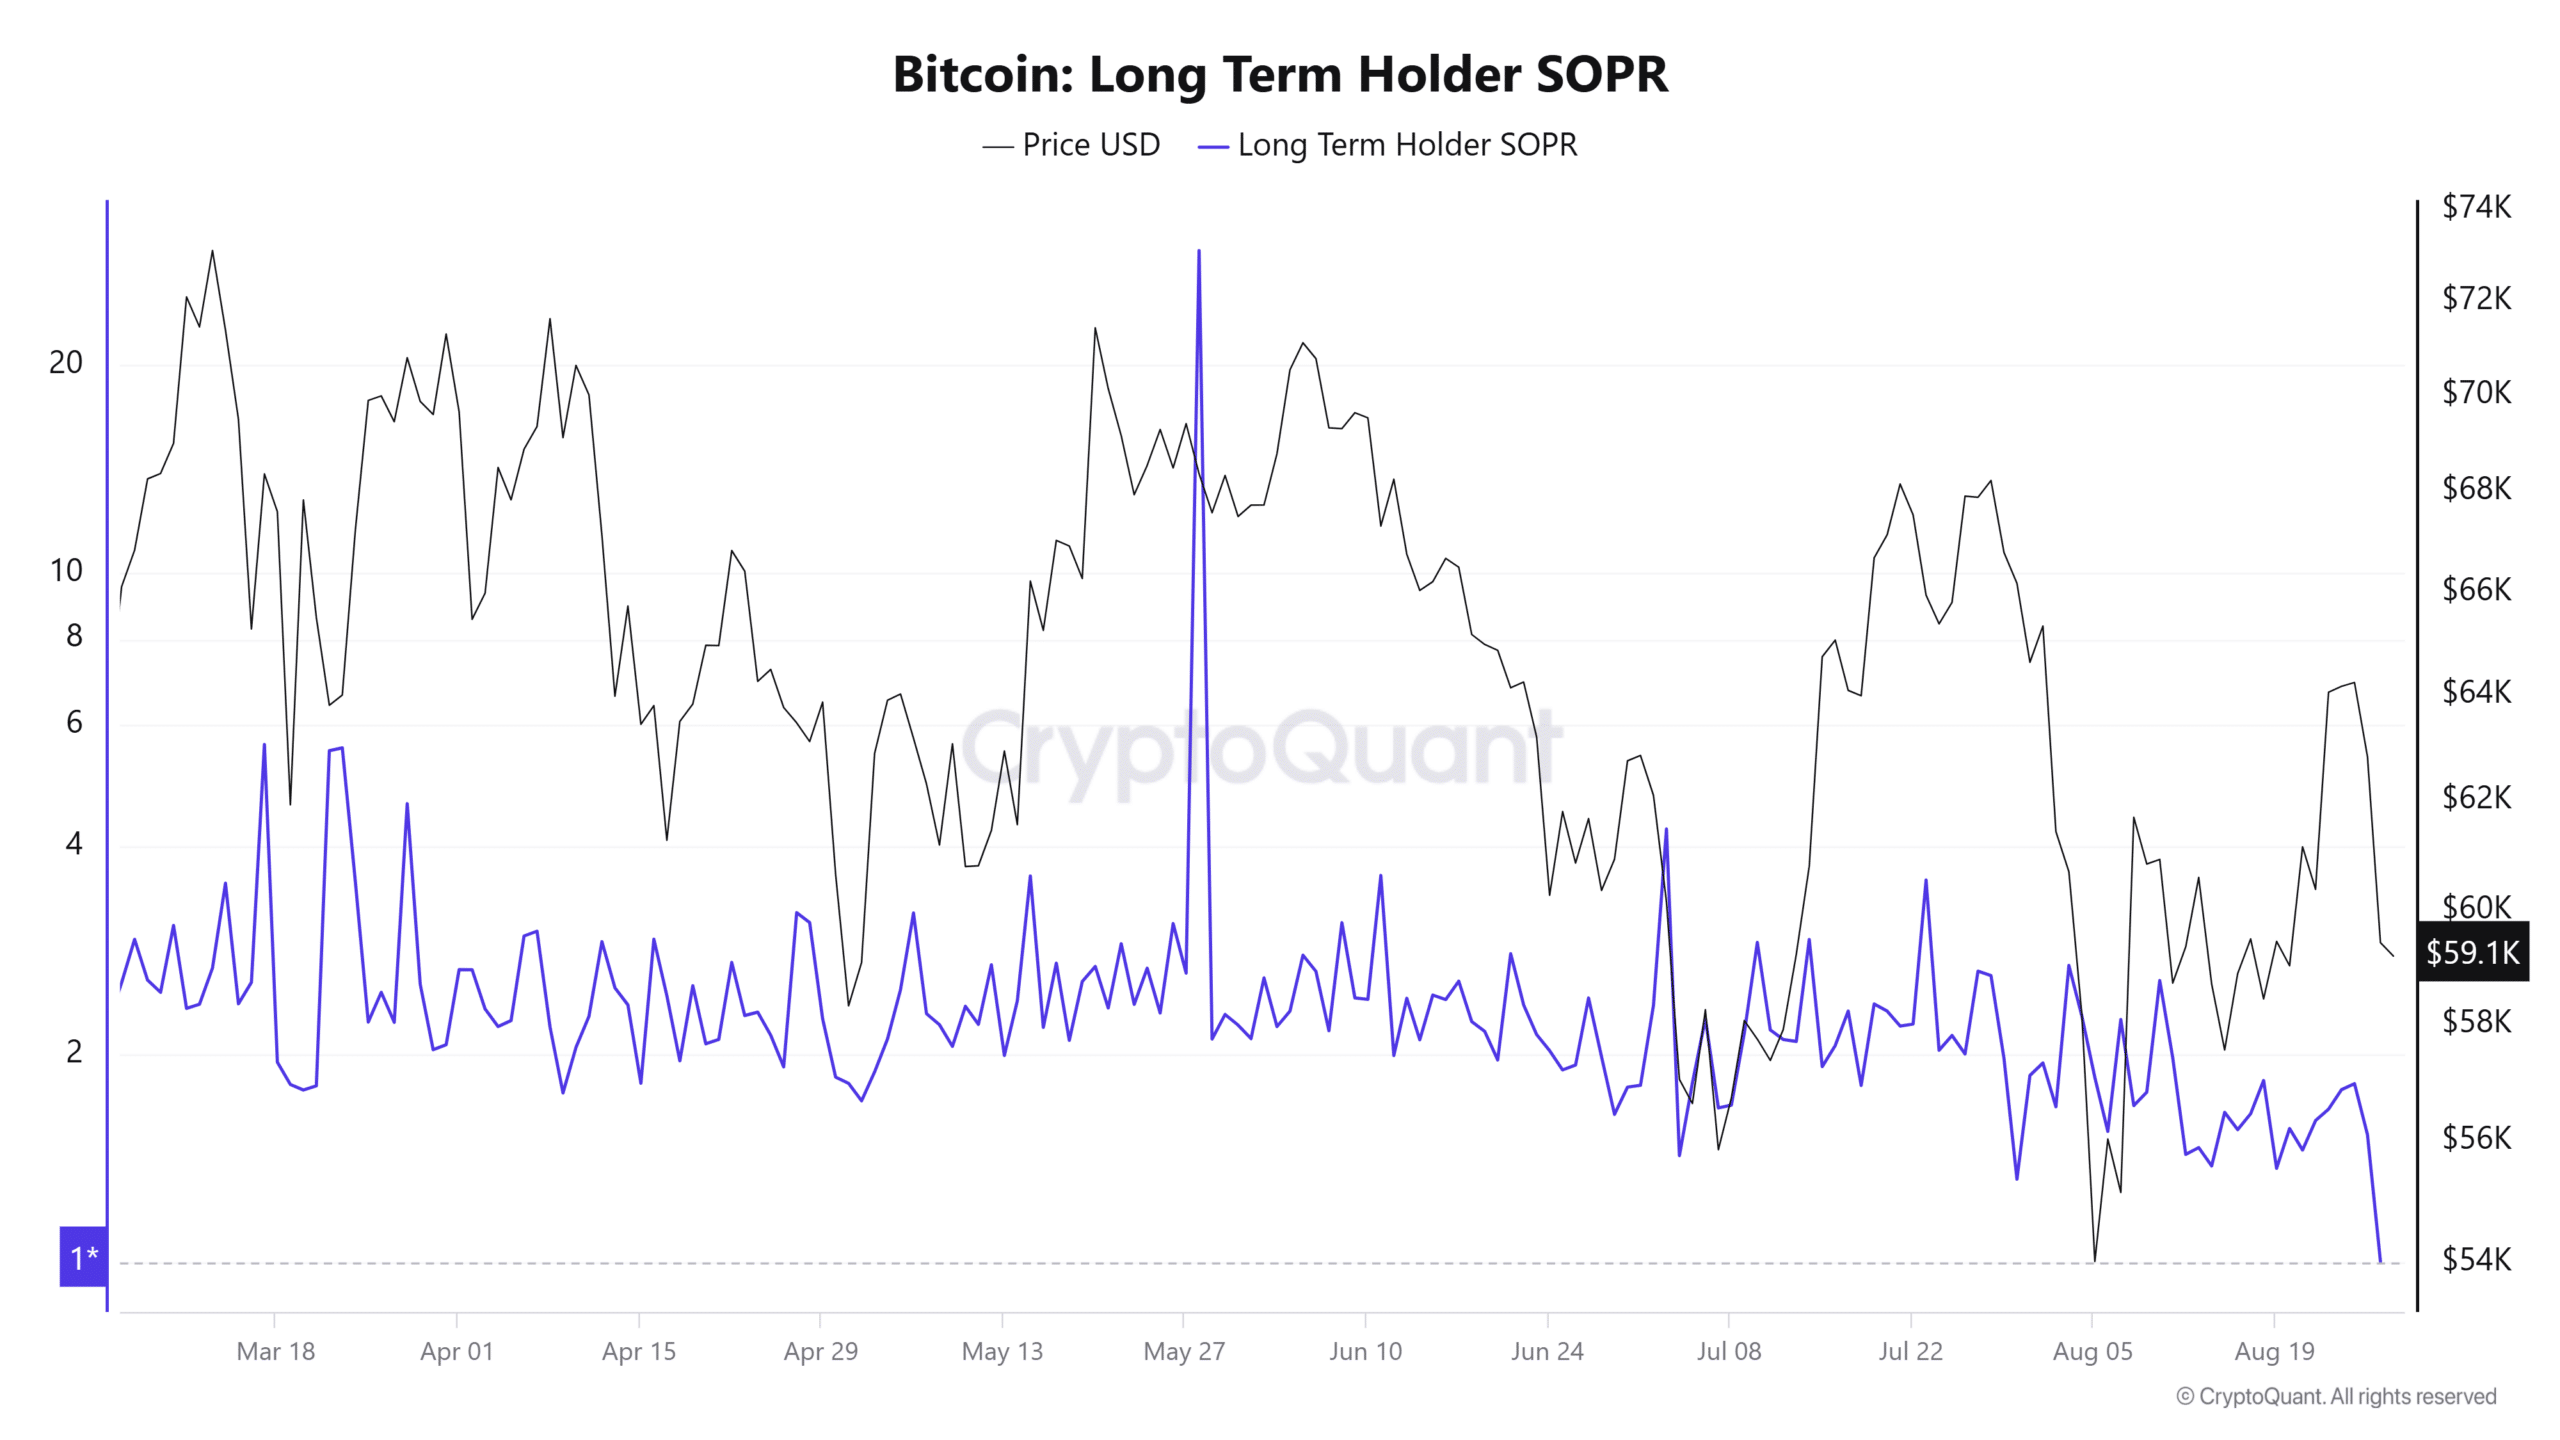
On-chain indicators show that the recent drop pushed long-term holders to a break-even point. The last time that this cohort was at this point was on 5th August, after which the price made a strong positive correction.
This metric could indicate that the recent drop formed a local bottom, suggesting that the price could rise.


Source: CryptoQuant
Data from IntoTheBlock showed that more than $3 million addresses bought BTC at between $58K-$62K. Therefore, $62,355 might act as a crucial resistance level if BTC resumes the uptrend.
Source: https://ambcrypto.com/crypto-liquidations-top-300m-in-24-hours-whats-behind-the-crash/