- Metric revealed that Bitcoin was overvalued.
- A price correction might bring BTC down to $61k again.
After going near $65k, Bitcoin [BTC] once again turned bearish as the king of cryptos’ daily chart turned red. While that happened, short-term holders continued to sell their holdings. Does this mean a trend reversal or a continued price drop? Let’s find out.
Is selling pressure rising on Bitcoin?
The king coin’s price increased by more than 8% last week. The uptick allowed bulls to push the coin towards $65k on the 24th of August.
However, things took a u-turn in the last 24 hours as BTC’s price dipped marginally. According to CoinMarketCap, at the time of writing, Bitcoin was trading at $63,816.53 with a market capitalization of over $1.28 trillion.
In the meantime, intoTheBlock posted a tweet revealing an interesting pattern. As per the tweet, important information can be obtained by keeping an eye on short-term traders’ balances.
Historically, surges in the metric have regularly coincided with market tops and bottoms, providing useful cues for timing the market.
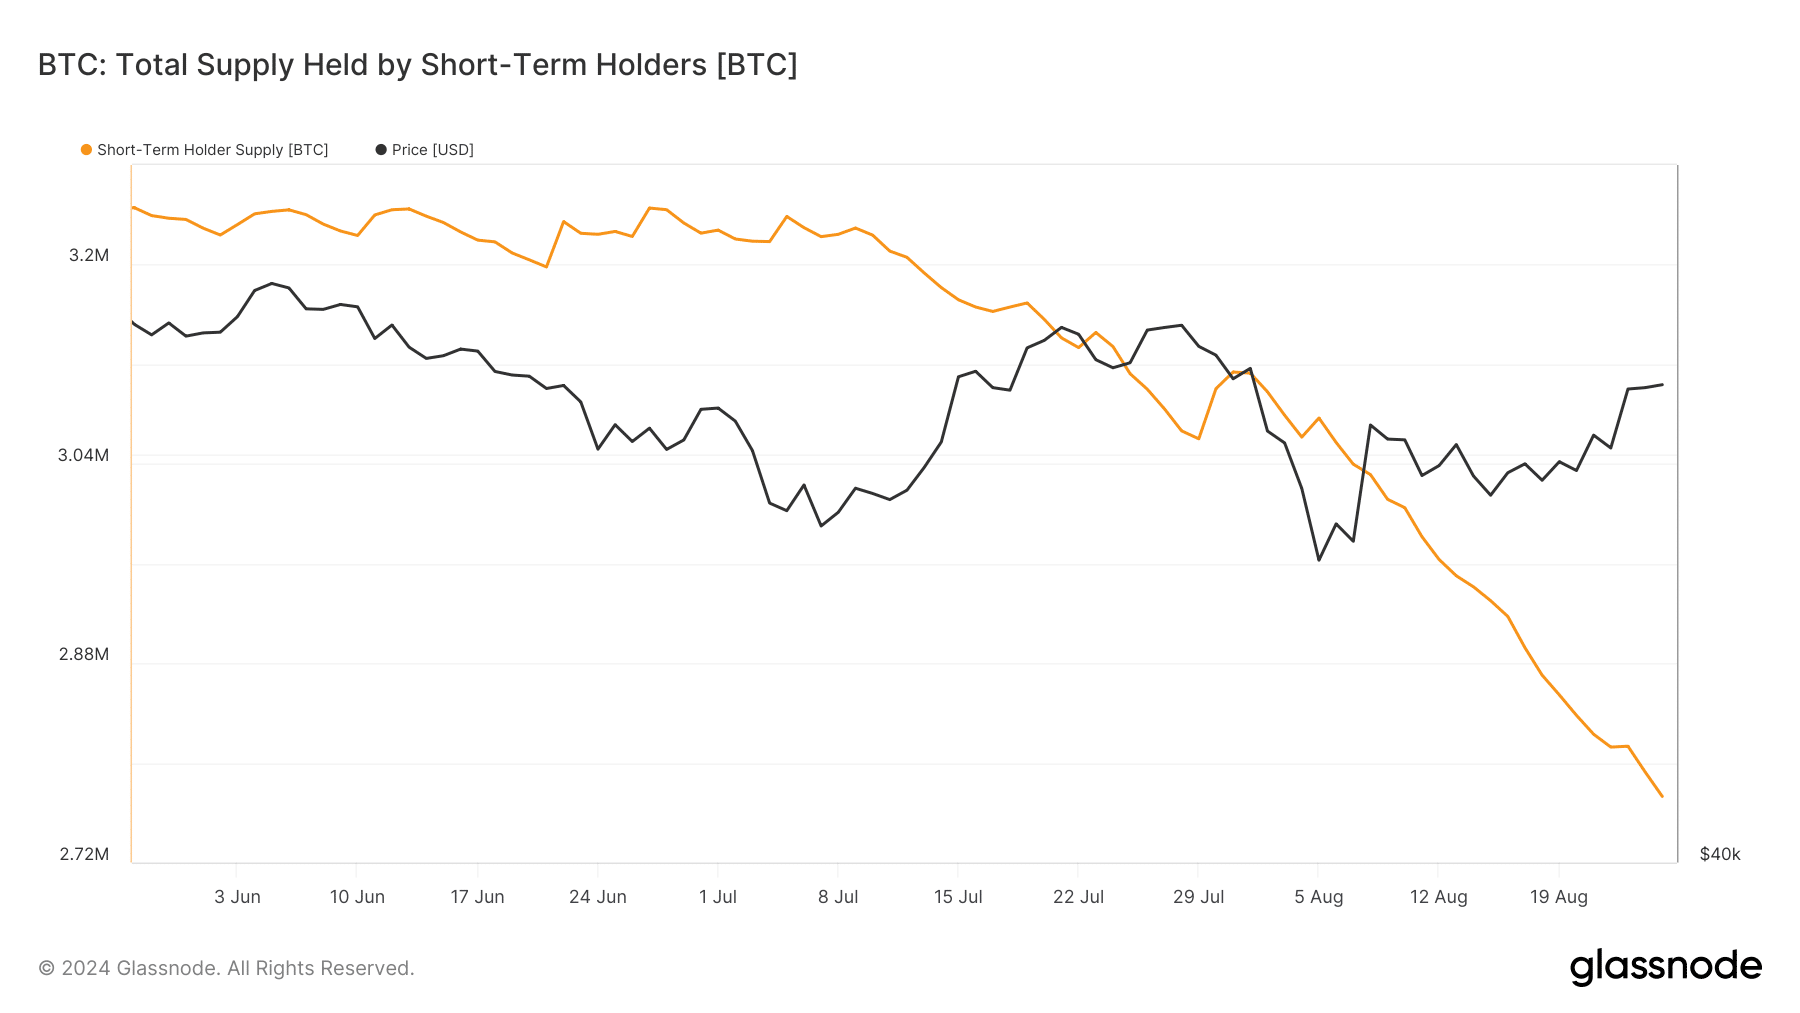
AMBCrypto then checked Glassnode’s data to find out how STHs were behaving. As per our analysis, the STHs were on a selling spree. This was evident from the massive drop in the total supply held by short-term holders over the last three months.


Source: Glassnode
BTC’s road ahead
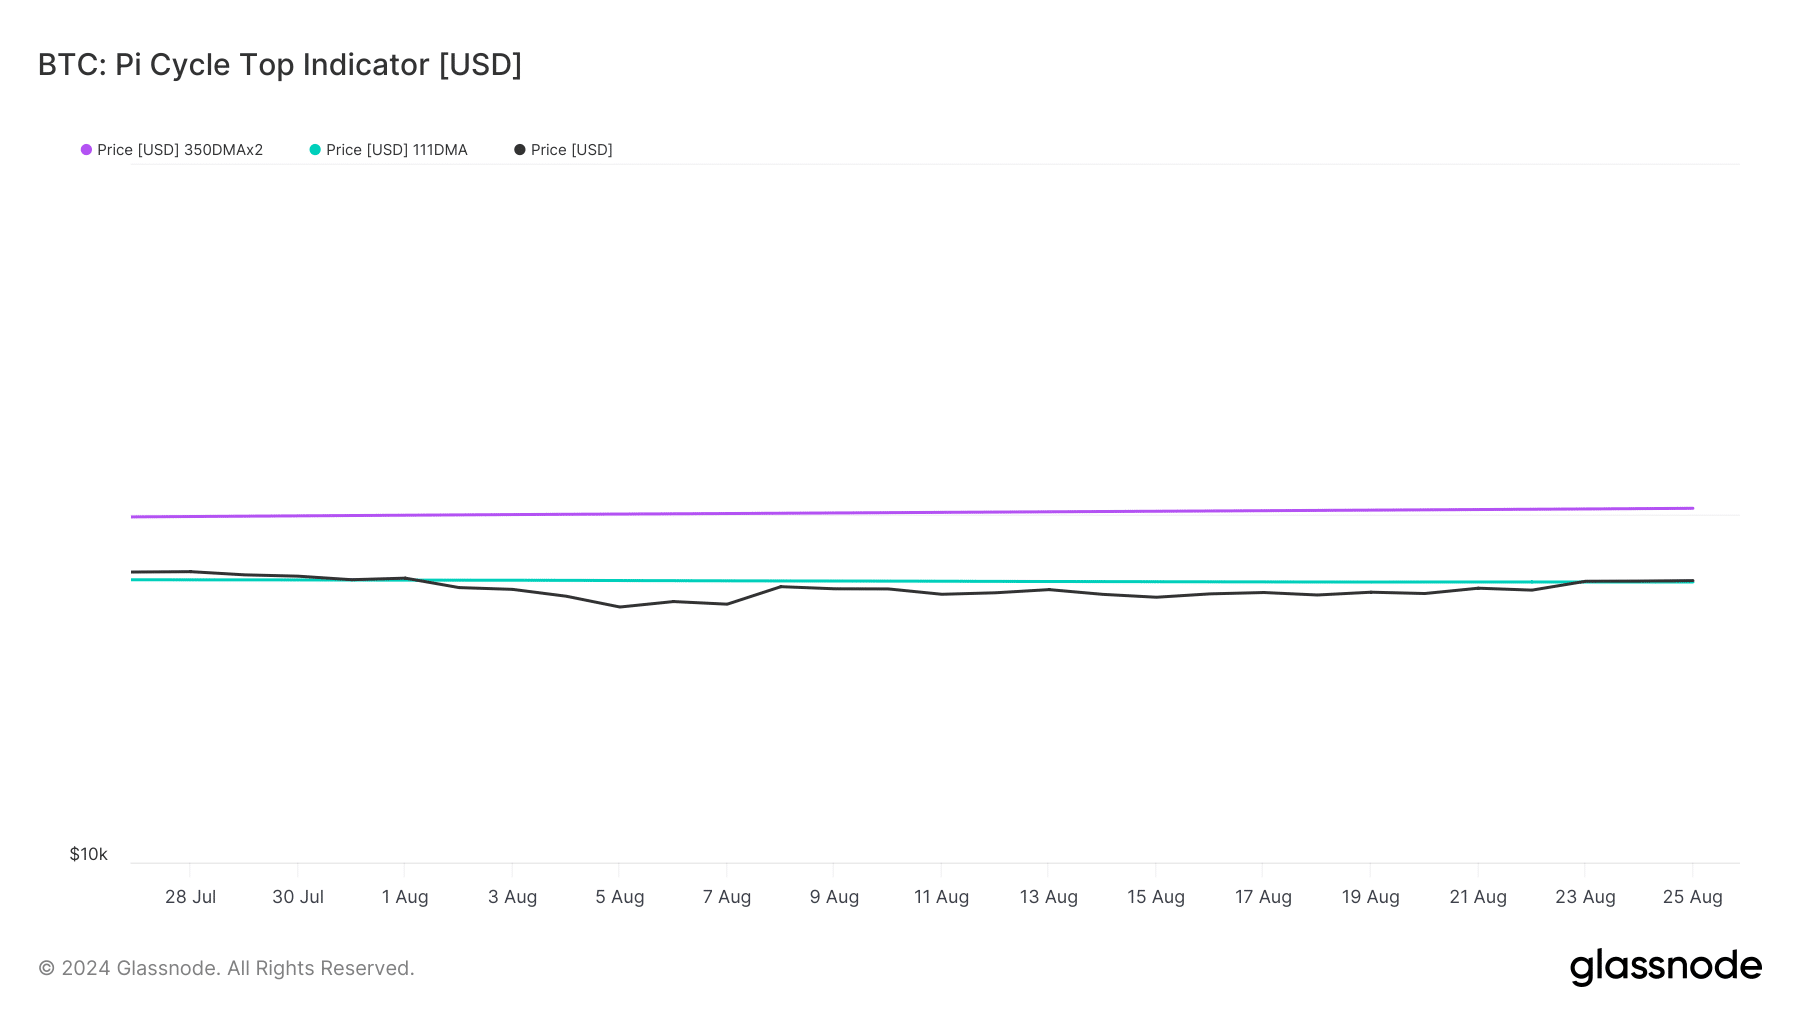
To find out whether BTC was at its market bottom, AMBCrypto took a look at BTC’s Pi Cycle Top indicator. As per our analysis, BTC was sitting right at its market bottom of $63.7k.
If the indicator is to be believed, then BTC might soon start its bull rally and reach its possible market top of $102k in the coming weeks or months.


Source: Glassnode
We then checked other metrics to find out how likely it is for Bitcoin to begin a fresh bull rally. Our analysis of CryptoQuant’s data revealed that BTC’s Coinbase premium was green.
This meant that buying sentiment was strong among US investors.

Source: CryptoQuant
BTC’s net deposit on exchanges was also low compared to the last seven-day average, signaling a rise in buying pressure. However, the king of cryptos’ NVT ratio registered a sharp uptick.
Generally, a rise in the metric means that an asset is overvalued, suggesting a price correction.

Source: Glassnode
Read Bitcoin’s [BTC] Price Prediction 2024-25
Like the aforementioned metrics, market indicators also looked pretty bearish on BTC. For example, the Chaikin Money Flow (CMF) registered a downtick. The Relative Strength Index (RSI) also followed a similar path.
These indicated that investors might witness BTC’s price to decline in the short-term before it regains bullish momentum.

Source: TradingView
Source: https://ambcrypto.com/why-bitcoins-short-term-holders-may-drag-price-down-to-61k/