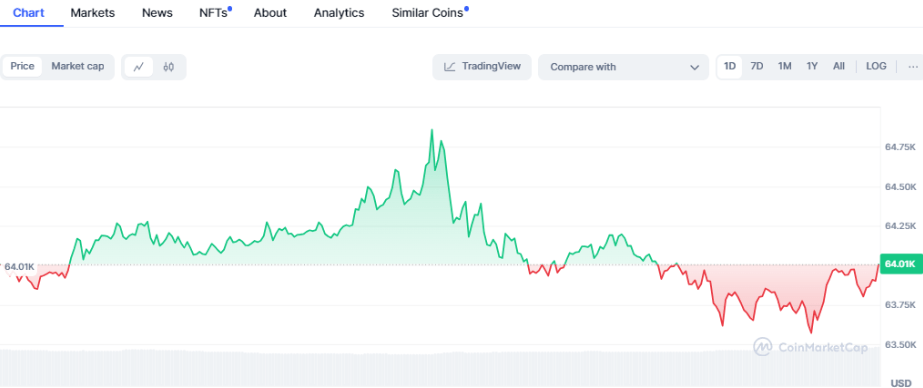
Bitcoin’s price action has captured the attention of analysts and traders alike as it hovers just below the critical $65,000 resistance level. After a week of steady gains, Bitcoin climbed from an opening price of $58.11K to a weekly peak of $65,000 before exhibiting slight dips and stabilizing above $63.90K.
This strong upward movement has fueled speculation about whether the cryptocurrency can break through the $65K barrier, a hurdle that many believe could trigger a new phase of bullish momentum.
A Week of Gains and Fluctuations
For a week, the price of Bitcoin has shown constant growth amidst a few tiny drops. The coin rose to $65K after hitting rock bottom earlier, implying strong demand and continued interest from traders.
However, Bitcoin’s daily chart depicts an even more erratic course in which the currency fluctuated while still pushing up. As of this publication, Bitcoin costs $63,978. This indicates only a slight decrease of 0.04% from its recent highs.


This slight dip has done little to dampen the optimism surrounding Bitcoin’s potential to break through the $65,000 resistance, though it has introduced a note of caution among some analysts.
Analysts Outlook: Mixed Sentiments on the Potential Breakout
Among the renowned figures in the crypto community, Rekt Capital has expressed optimism about Bitcoin’s current price action. The analyst notes that BTC has moved past its downside deviation and is now on the verge of reclaiming its weekly re-accumulation range.


Should this be confirmed, it may signal the demise of the bargain-buying era and the start of another upturn. In addition, Rekt Capital notes that Bitcoin is now in a position to challenge its diagonal resistance, which has kept it bearish since March.
The analyst further explains that as Bitcoin remains above $61,500 going into the new weekly close, it likely marks the first week of a cross-channel ascent. This would suggest that BTC’s uptrend has resumed and might set the stage for a further breakout.
However, not all analysts share this optimistic outlook. For instance, CrypNuevo issued warnings about potential obstacles to confirming an end to recent bearish trends on BTC’s charts. He points to key support levels at $63,500 and $62,200 on the 1-hour and 4-hour timeframes, aligning with the 50-period EMA.
If we do a full analysis on the liquidations, we can notice a few things:
• The Delta liquidations is approaching a risky level that could lead to a long squeeze – a drop to liquidate some longs.
• The levels with more liquidations are $63.5k (1h50EMA) & $62.2k. pic.twitter.com/JUdOUbVVuz
— CrypNuevo 🔨 (@CrypNuevo) August 25, 2024
If these levels fail to hold, CrypNuevo refers to it as a “Bart Simpson” pattern, indicating that Bitcoin could retreat to its 50-period EMAs. This pattern implies a sharp decline following a rise, resembling Bart Simpson’s head, where Bitcoin would quickly give up recent gains and move back to a lower support level.
Also Read: DOGS Binance Listing Sparks Price Speculation: Can it go $0.001?
Source: https://www.cryptonewsz.com/bitcoin-near-key-barrier-can-it-break-past-65k/