Bitcoin (BTC) has broken out of the $60,000 psychological level, regaining the price region above this mark. Following a volatile three-day price action, analysts expect the leading cryptocurrency to present a “Bart Simpson” chart pattern, correcting downwards.
In particular, the crypto analyst and trading expert who goes by the pseudonymous CrypNuevo has drawn his Bitcoin price prediction. This projection comes in the form of CrypNuevo‘s weekly “Sunday Update” and sets the plan for this trading week.
The analyst expects a week primarily driven by very short-term price action, liquidation imbalances, and low time frame technical analysis. As he said, “We have a nice trading week ahead,” considering the “economic calendar is quiet.”
Bitcoin wick-filling strategy and liquidity pools
First, the trading expert refers to his known wick-filling strategy and liquidity pools for other traders as leading indicators. These concepts are a usual part of CrypNuevo‘s trades and have a high accuracy rate, as Finbold has previously reported.
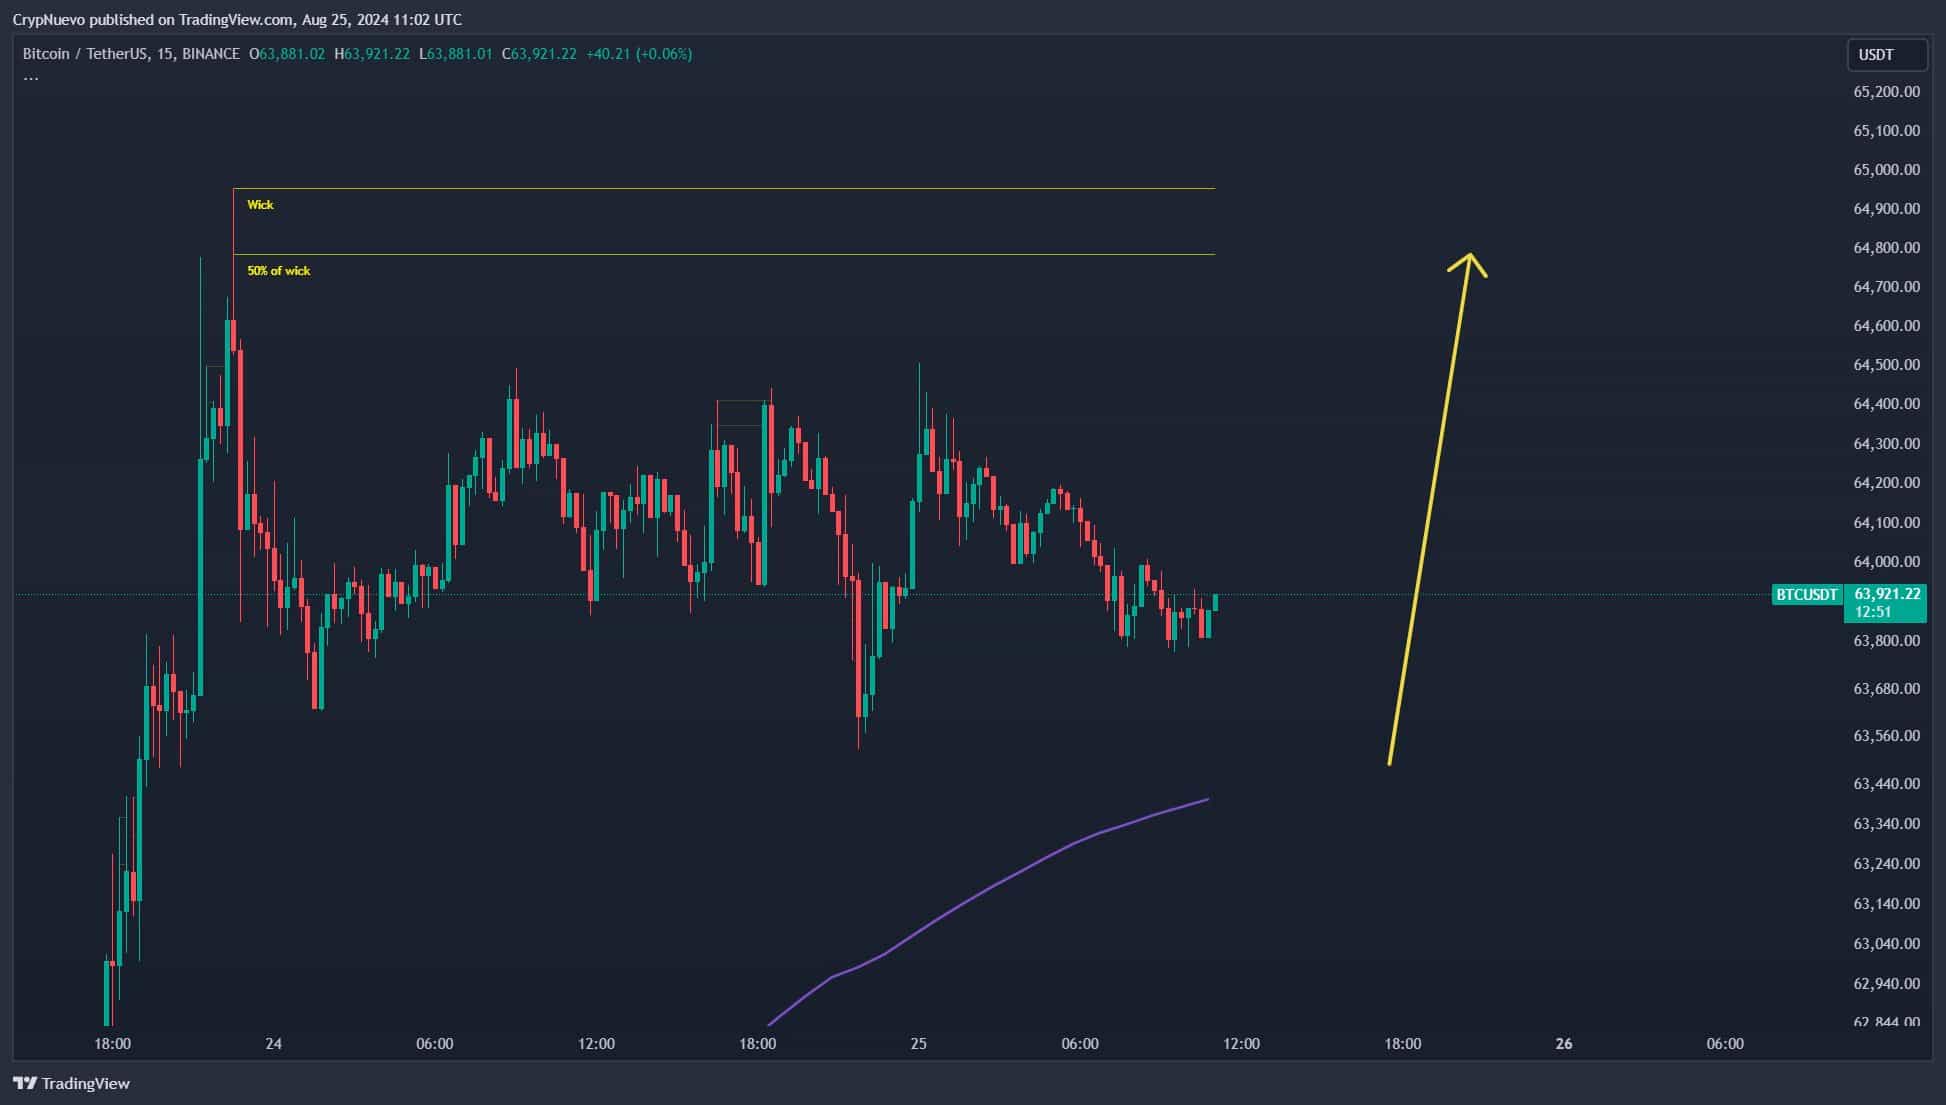
In this case, Bitcoin’s 15-minute price chart has a wick topping at $65,000, which could act as a magnet. However, the most likely target is at the 50% filling of the wick, at around $64,750. The analyst believes BTC will first move upwards, liquidating idle “sell” orders, stop losses and Bitcoin short-sellers.
The ‘Bart Simpson’ chart pattern
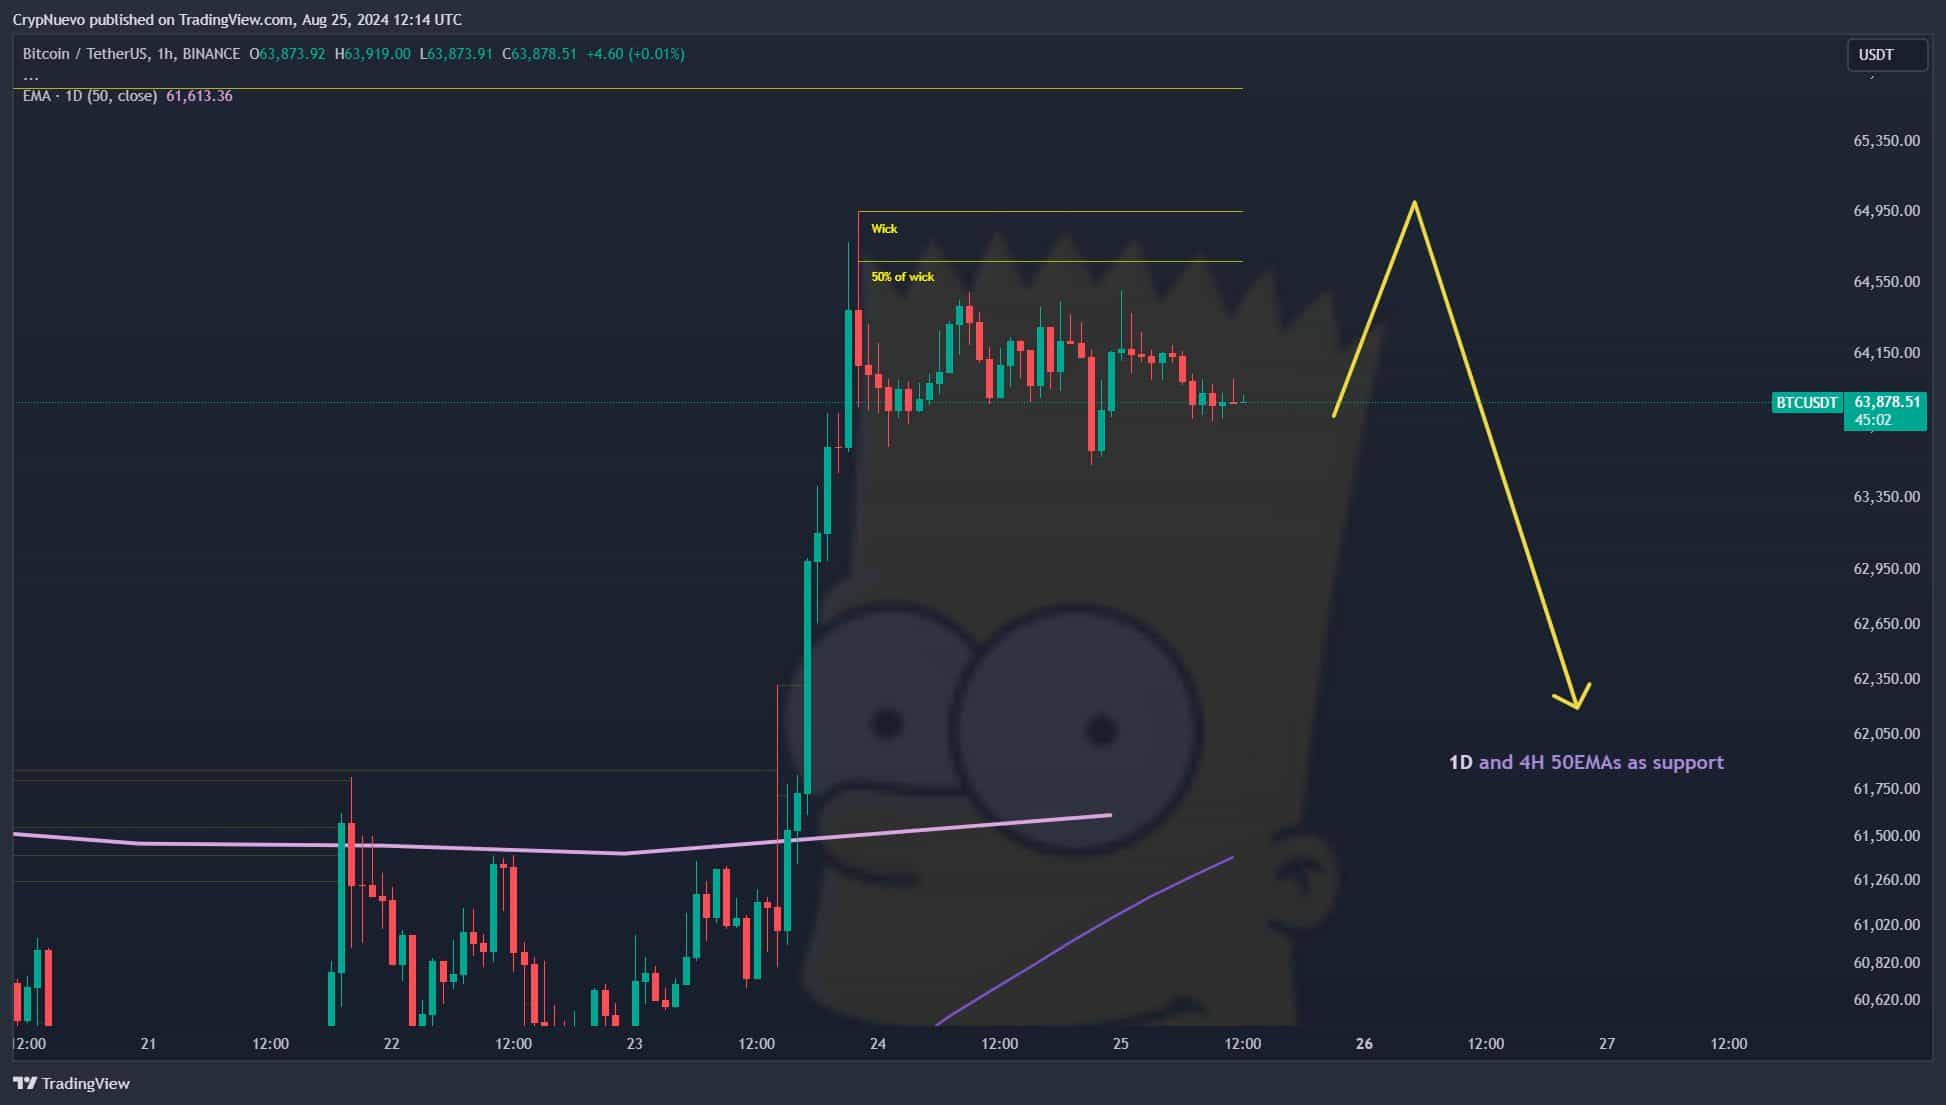
Then, the next step will be a necessary price correction to clear imbalances as “breakout traders” are trapped with momentum. CrypNuevo believes in an imminent retracement right after the wick-filling strategy is completed, playing a “Bart Simpson” chart pattern.
Interestingly, this pattern started as a trading meme, but many analysts have already seriously considered it for making price predictions. The “Bart Simpson” appears after a local top, followed by consolidation in a tight volatility, resembling the character’s hair.
After this consolidation period, Bitcoin can aggressively drop, drawing Bart’s head along with the first impulse.
If this pattern plays out, the trading expert targets the 50-period exponential moving average of both the one-day and four-hour price charts as the correction’s support. Essentially, hovering between the $60,000 and $62,000 marks.
Despite CrypNuevo‘s good track record, cryptocurrencies are fairly unpredictable, and there is no guarantee that this analysis will happen as described. Traders should create their own strategies and seek insights from different analysts.
Sided with CrypNuevo, the renowned trader Alan Santana also expects an incoming crash for Bitcoin’s price, as Finbold just reported.
Disclaimer: The content on this site should not be considered investment advice. Investing is speculative. When investing, your capital is at risk.
Source: https://finbold.com/bitcoin-analyst-warns-of-bart-simpson-pattern-and-btc-price-correction/