Amazon (NASDAQ: AMZN) has recently shown a significant recovery following a sharp decline between July and August 2024.
Despite experiencing a notable drop from its yearly highs above $200, largely due to a broad stock market downturn at the start of August, Amazon has, in more recent trading, initiated a strong recovery.
Over the past two weeks, the stock has posted its strongest performance since October 2023, marking a crucial rebound from the losses sustained in the preceding months.
This rebound is particularly noteworthy given the stock’s technical setup, which now suggests the potential for further upside, with a target price of $240.
In analyzing Amazon’s recent price action, trading expert TradingShot highlights the significance of the stock’s adherence to a long-term upward channel, known as a “Channel Up,” which has persisted for over 2.5 years.
Recent price movements and support levels
During the recent decline, Amazon’s price briefly dipped below the 50-week moving average (1W MA50, blue trend-line) for the first time since May 2023, initially causing concern among investors.
However, the stock quickly regained this level, underscoring its importance as a key support. Additionally, the 200-week moving average (1W MA200, orange trend-line) provided further support during this downturn, preventing a deeper decline and maintaining the stock’s long-term bullish outlook.
Currently, Amazon faces crucial resistance at the 50-day moving average (1D MA50, red trend-line).
Historically, breaking above this level following a low has led to substantial gains, with previous legs in this pattern yielding 79% and 69% increases, respectively. The current resistance is the final hurdle before a confirmed breakout toward the $240 target.
Amazon stock technical indicators
The current “Channel Up” pattern is characterized by a series of higher lows and higher highs, indicative of a sustained bullish trend.
Sine Waves on the weekly chart clearly illustrate the cyclical nature of this pattern. Historically, each time Amazon’s stock touched the lower bound of this channel, it rebounded sharply.
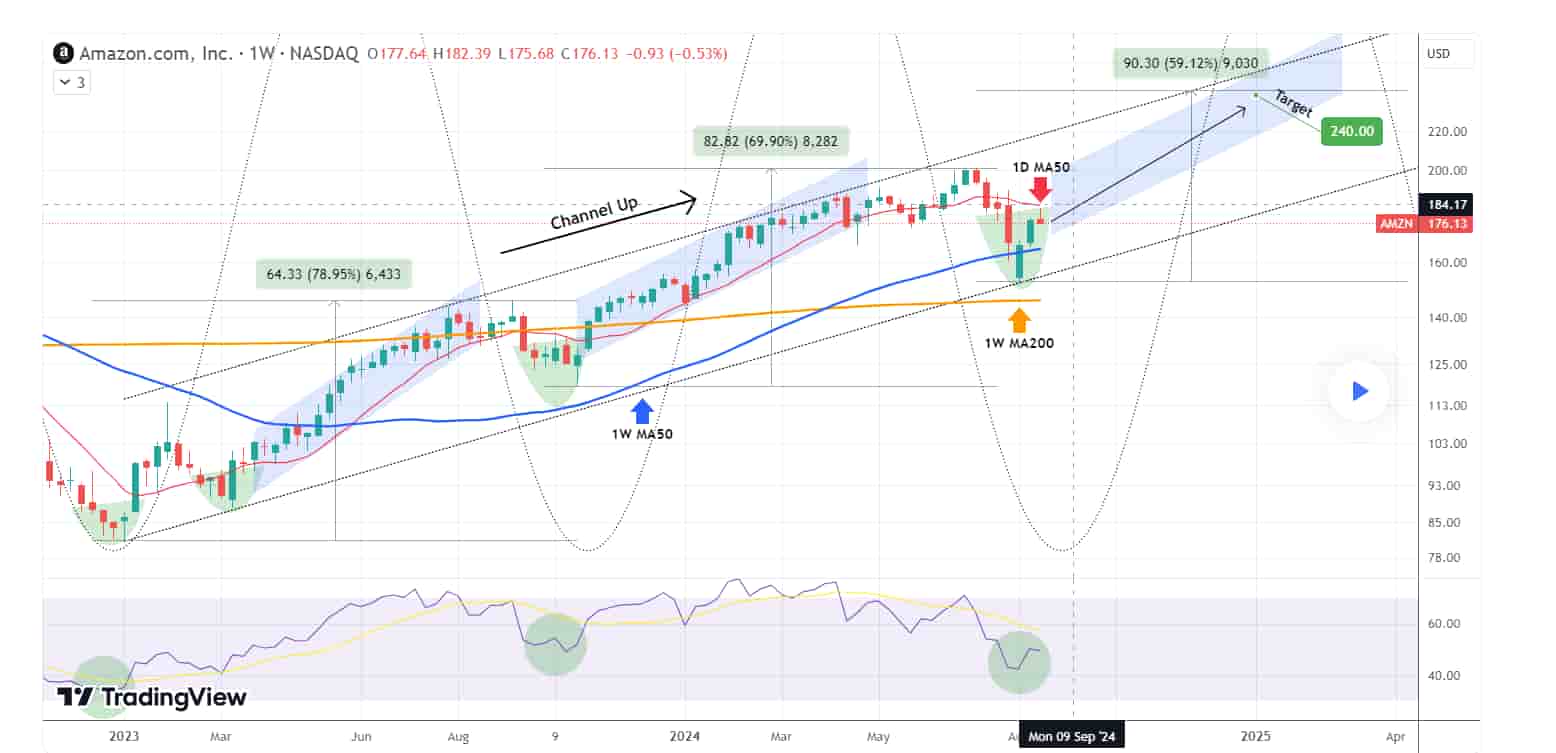
Every time the price broke above the 50-day moving average (1D MA50, red trend-line) following such a low (three times), it approached the top of the Channel Up.
The current one-week RSI value of around 50, positioned below its moving average, suggests a neutral zone but leans toward a bullish scenario given the historical context.
In previous cycles, when the RSI was similarly positioned, the stock experienced significant upward movements.
As the stock price approaches the upper bounds of the channel, the RSI typically increases, signaling stronger momentum. A rise in the RSI towards the overbought zone (above 70) could coincide with the stock reaching the $240 target.
Moreover, If Amazon successfully breaks above the 50-day moving average (1D MA50), which applied high selling pressure this week, the stock is likely to continue its ascent within the upper channel. The historical pattern suggests that the current bullish leg could gain around 59% from the breakout point, aligning with the $240 target.
Given the current momentum and the cyclical nature of the stock’s movements, Amazon is expected to reach the $240 target within 3 to 6 months, ideally by mid-2025, assuming steady market conditions and no significant external shocks that could derail the upward trend.
In conclusion,the $240 target for Amazon is justified by the confluence of technical indicators, including the “Channel Up” pattern, RSI values, and key moving averages.
The RSI’s current neutral position below its moving average suggests room for growth, while the strong support at the 1W MA200 and the potential breakout above the 1D MA50 provide a clear path to higher levels.
Investors should watch for a confirmed breakout above the 1D MA50 as a bullish signal that the stock is on track to meet the $240 target by early 2025
Disclaimer: The content on this site should not be considered investment advice. Investing is speculative. When investing, your capital is at risk.
Source: https://finbold.com/analyst-sets-amazon-stock-price-roadmap-to-240/