Published 14 hours ago
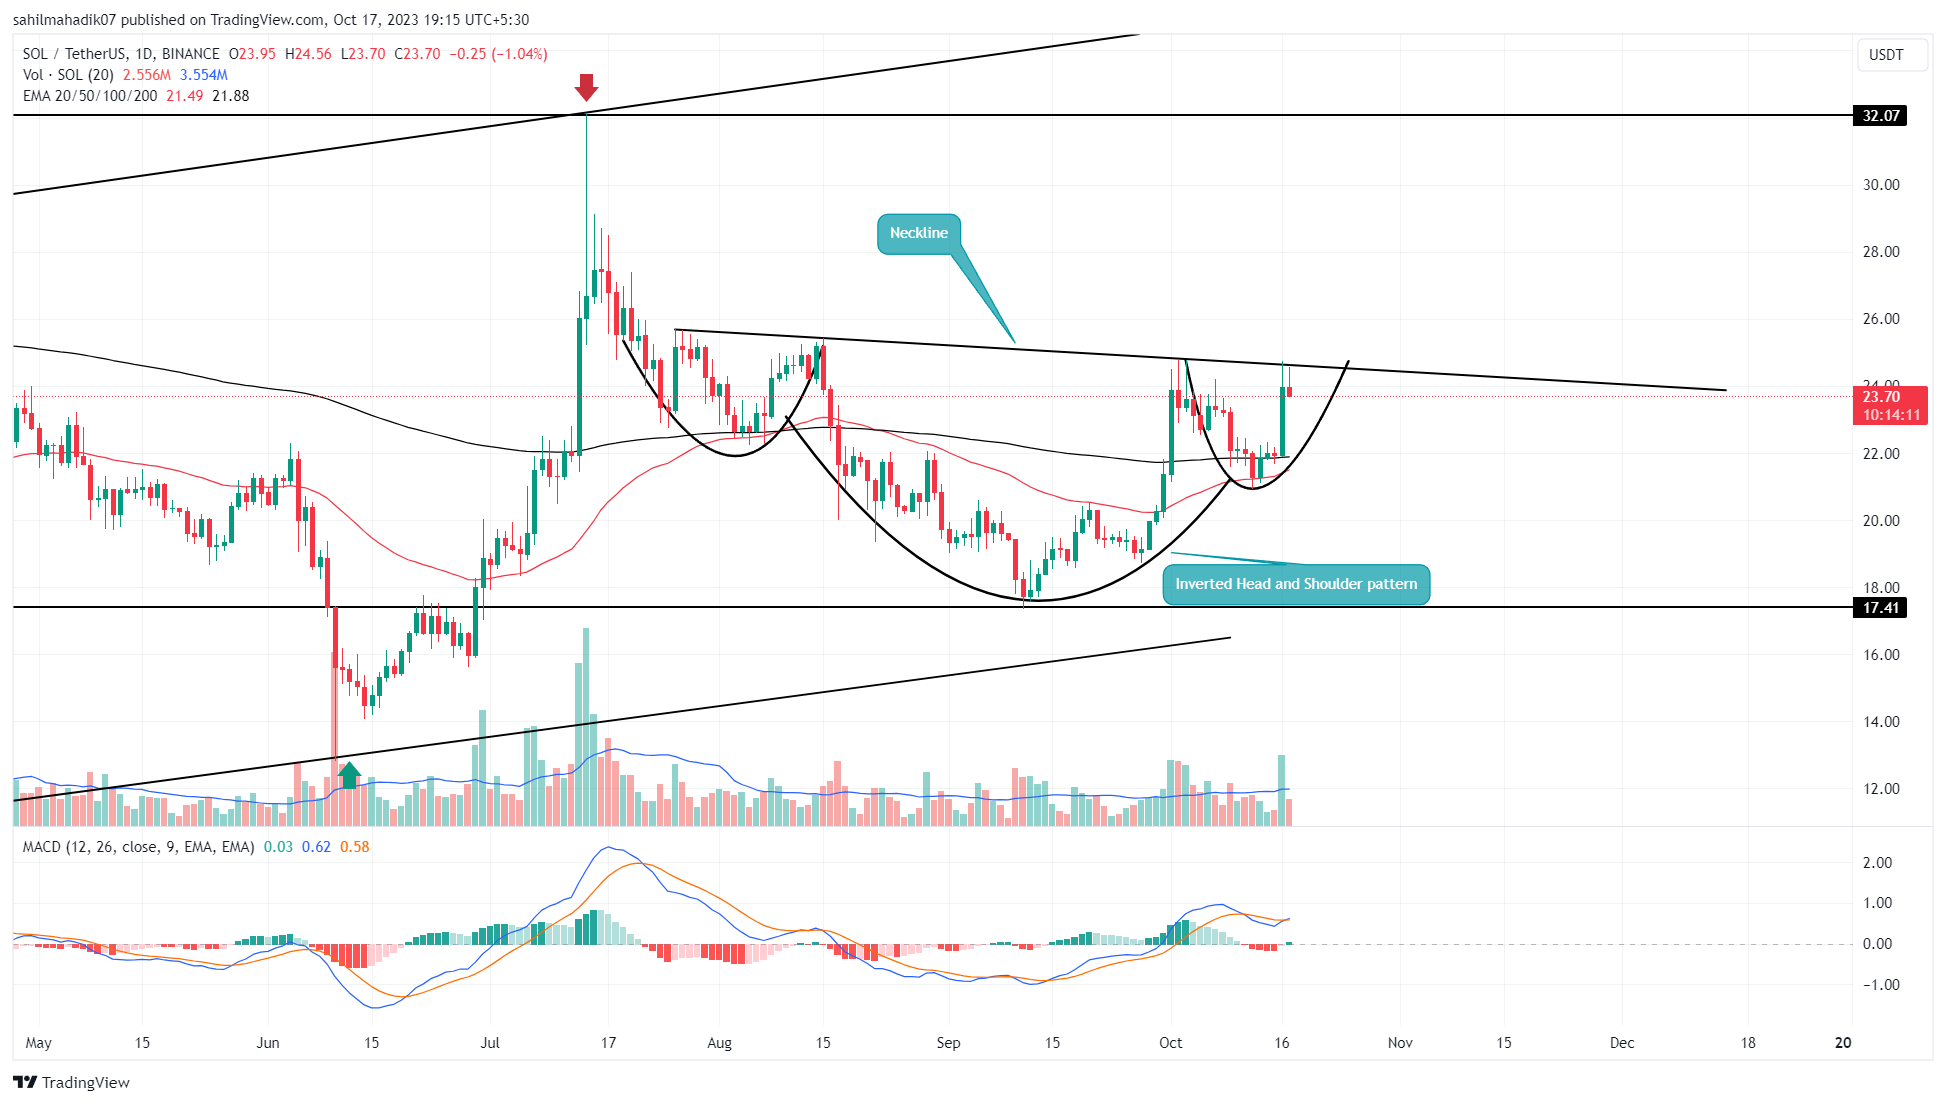
The recent market uptick has seen the Solana coin make a sharp reversal from the $21 level, recording a 14.67% rally in the last 5 days. This rally has now brought the coin’s price up to the neckline resistance of a bullish reversal pattern known as the inverted head and shoulders. This pattern is often a strong indicator of a potential market reversal, indicating the SOL price is poised for a significant rally.
Also Read: Is Solana a Good Investment in 2023?
Will SOL Price Reagin $30 Mark?
- The SOL price breakout from overhead neckline resistance could set a 30% upswing.
- The 50-day EMA acts as strong support during minor pullbacks.
- The 24-hour trading volume on the Solana coin is $604 Million, indicating a 16% gain.
 Source-Tradingview
On the daily timeframe, the Solana price shows the formation of an inverted head and shoulders pattern. This reversal pattern, coupled with increased buying pressure in the crypto market—potentially driven by rumors of the SEC approving spot Bitcoin ETF—has led to a price recovery to $25.
This price level is particularly significant because it aligns with the neckline resistance of the inverted head and shoulders pattern, making it an area of high interest for traders. At present, the SOL price is trading at $24, facing resistance at the $25 mark as evidenced by the high wick rejection candles. This indicates that sellers are currently defending this level.
However, the presence of the inverted head and shoulders pattern suggests that buyers are more likely to breach this resistance level, potentially indicating an upcoming bullish phase. A daily candle closing above this neckline resistance would provide strong support for an extended recovery.
In such a case, a post-breakout rally could push the SOL price up by 30% to reach its July 14th high of $32.
SOL vs BTC Performance
 Source: Coingape| Solana Vs Bitcoin Price
In a comparative analysis, both Bitcoin and Solana have been trading sideways since the beginning of 2023. However, a closer look at their respective price charts reveals that SOL coin has been more volatile, displaying large price swings, while Bitcoin price has remained relatively stable. Investors in Solana should therefore be prepared for this increased volatility and stick to their trading plan.
- Relative Strength Index: The daily RSI slope above 60% reflects the bullish momentum is suitable for a recovery rally.
- Exponential Moving Average: The flattish movement in the 50-and-200-day EMA accentuates a sideways trend in play.
Share this article on:
The presented content may include the personal opinion of the author and is subject to market condition. Do your market research before investing in cryptocurrencies. The author or the publication does not hold any responsibility for your personal financial loss.
Source: https://coingape.com/markets/solana-price-prediction-as-bullish-pattern-hints-rally-to-30/