BCH coin price shows higher rejection from the resistance trendline in the 4-hour chart. The range breakout rally struggles to exceed the resistance trendline and retests the breakout. With five candles struggling to sustain above the $250 level, BCH coin price projects solid underlying bullish sentiment.
In the 4-hour chart, the BCH price action displays a descending triangle with the bottom support at $228. However, the 200-day EMA remains a crucial support level and absorbs excessive supply to provide a bounce pad for BCH price.

At the moment of writing, the BCH coin price shows higher price rejection in the daily candle, with a 0.05% drop. Ready to form an evening star pattern at the resistance trendline, BCH price action hints at a negative cycle in the falling channel pattern.
However, the Bitcoin Cash price can regain the bullish momentum at $228 or the 61.80% Fibonacci level.
On the other hand, a daily candle closing above the falling channel will signal a new bull cycle in Bitcoin Cash. Traders can expect the refreshing spree to challenge the previous swing high of $307.
On an optimistic note, the BCH price rally can exceed the $307 mark to challenge the 1.618 FIbonacci level at $435.
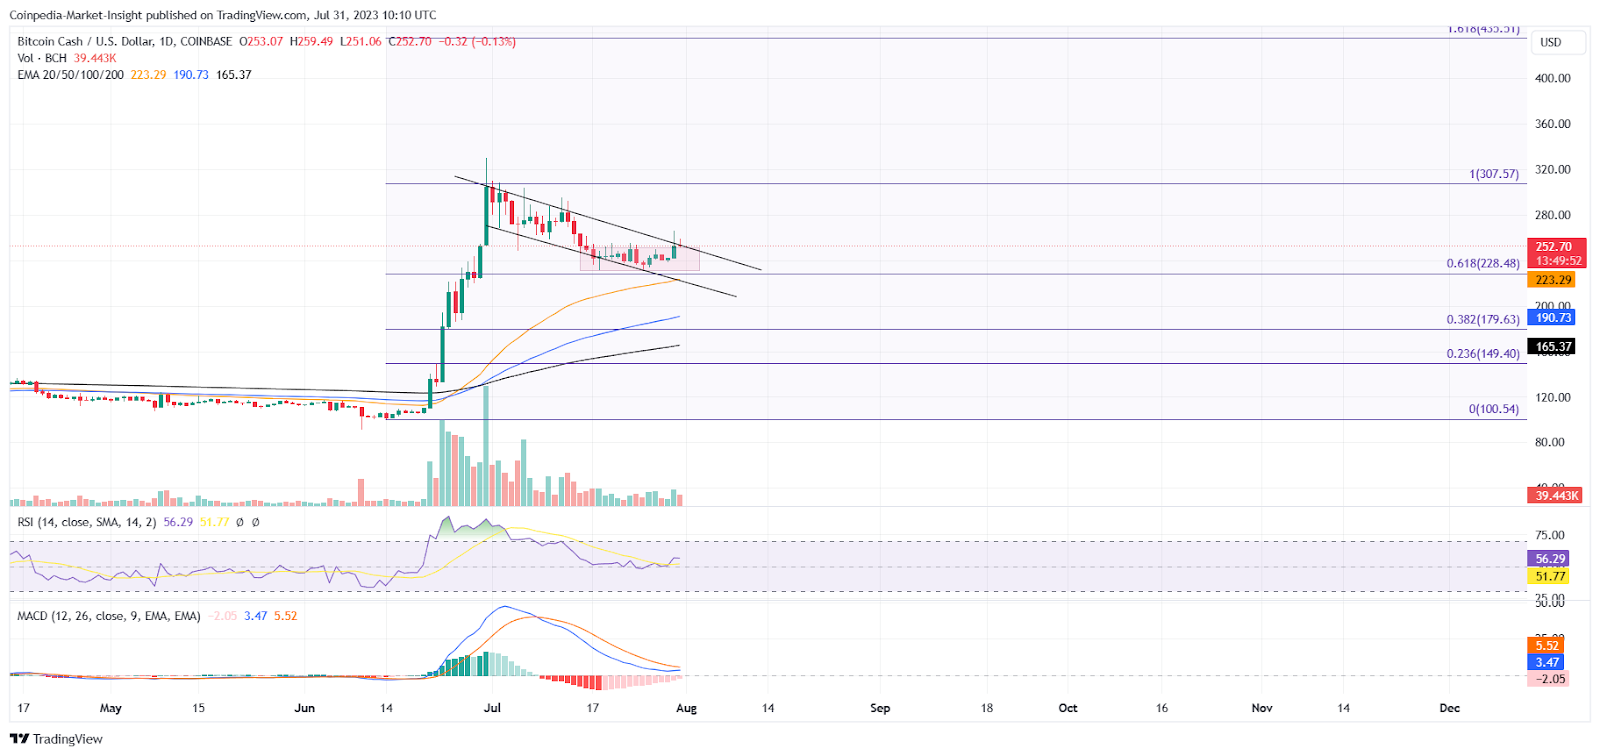
The MACD indicator preparing a bullish crossover in the daily chart, and RSI line displaying an uptick from the halfway line presents a similar opportunity. Therefore, the technical indicators maintain a positive outlook for Bitcoin Cash in August.

Moreover, the number of investors rose to +6% in the last month despite the 2.94% fall in BCH Whales managed to fuel the rally.
On the bearish side, the bullish hypothesis will fail if the BCH coin price falls below $228 in the negative cycle. The Bitcoin Cash price can plunge to $200 in such a case.
Source: https://coinpedia.org/price-analysis/bch-price-analysis-bullish-flag-furling-will-bitcoin-cash-price-top-400/